Results
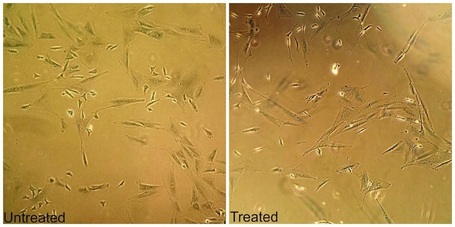
Figure 1. Methylene Blue Stain Less defined cells seen in the untreated sample and more defined cells seen in the treated sample.
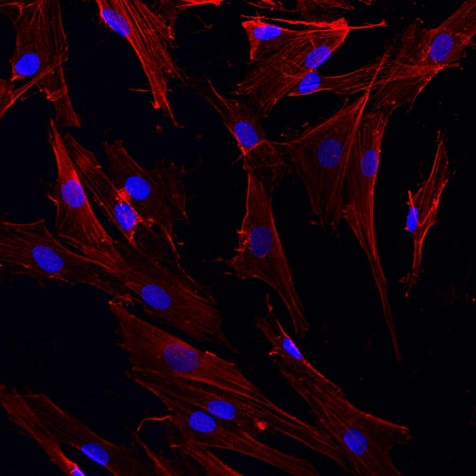
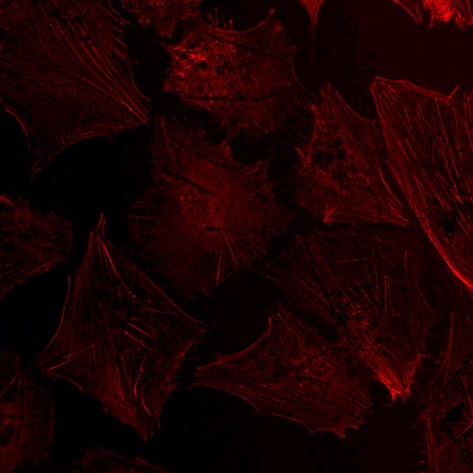
Figure 2. Phalloidin Cytoskleton Stain The left image is the untreated neuroblastoma cells. They have less projections (connections to other neurons) than the treated cells on the right. The treated cells have more pojections and are more neuron like after experiancing morphological changes. There was an error in the staining in the treated cells which don’t have the DAPI stain on the neucleus due to an error in the staining process. This has no effect on the outcome of the data because it is indiffernet to the morphological characteristics of the cell.
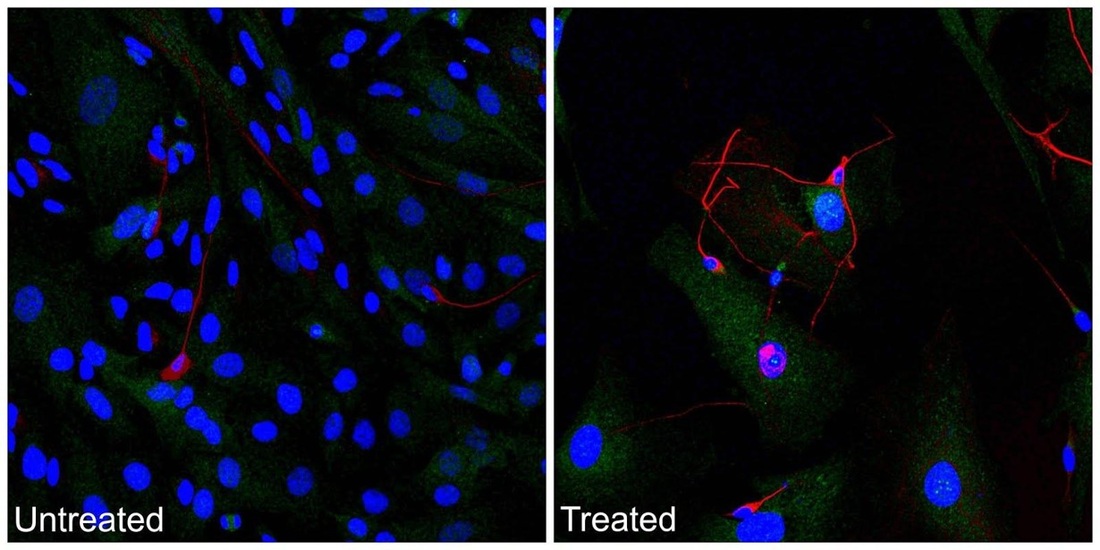
Figure 3. Immunoflourecent GFAP & β- Tubulin Stain The blue stain is the nucleus of the cell. The red stain is the GFAP and the green stain is the β-Tubulin. The untreated cells see less GFAP projections and slightly less overall β-Tubulin. It is also important to note that the untreated cells were overall at a much higher confluence than the treated cells. This shows that the treatment also suppressed the uncontrollable growing of the neuroblastoma.
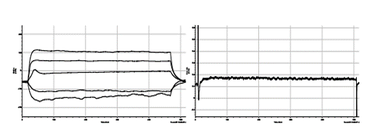
Figure 4. Control Conductivity Test The left graph shows the action potential of the control cell which was 22.5mV (Millivolts). The right graph shows the sodium spike of the control cell which was 0.0975nA (nanoamps). These results show a lack of ability to conduct electrical signal relative to the treated cells.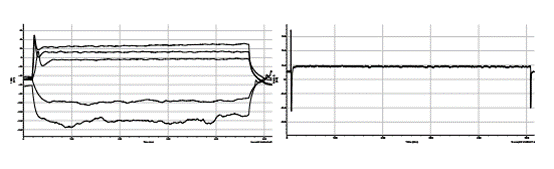
Figure 5. Treated Cells Conductivity Test The left graph shows the action potential of the treated cells which was 35mV (Millivolts). The right graph shows the sodium spike of the treated cell which was 0.487nA (nanoamps). This shows that the cell is able to better use its sodium ion pumps whereas the control cells were unable to use their sodium ion pumps as efficiently. This shows that retinoic acid forced a functional change in the cell when treated.
|
The experiment resulted in a total of 3 different sets of cells that were stained. A methylene blue, phalloidin, and GFAP & β-Tubulin. The first stain, methylene blue, showed the morphological changes of the cell indicated that the untreated cells had a more flat and spread out appearance in terms of its morphological characteristic. Additionally the cells showed few neural connections which are a characteristic of neurons. The untreated cells were also at a higher confluence than the treated cells which showed more compact cell bodies and a larger amount of projections.
The second stain performed was phalloidin which stains structural proteins in the cell. The results were similar to the methylene blue stain in that the untreated neuroblastoma cells appeared more obscure and had few projections. Again the treated cells expressed more projections and the cell body was narrower and more neuron like than the neuroblastoma cells. The final stain was the immunoflourecent stains which was specific to GFAP and β-Tubulin. The stain of the cells showed that there was essentially no difference in the amount of GFAP and β-Tubulin in the treated cells compared to the untreated cells. The stain however showed that there were more GFAP proteins and neural projections in the treated cells than in the untreated cells. The final test was a conductivity test. The results showed that the cells treated with retinoic acid had more sodium ion pumps than the untreated cells. The treated cells also were able to conduct a higher amount of energy than the untreated cells. Finally, the treated cells had higher active potential than the untreated cells. This shows that they have neuron like characteristics compared to the untreated cells and therefore had an effect from the retinoic acid. |